
Try the example
The example deck is a simulated Suzuki coupling screen: three syringe pumps charge a vial, a heater-stirrer holds it at temperature, and a UV-Vis probe and an HPLC read out how much product formed. There is nothing to plug in, and the chemistry responds the way a real screen would: yield depends on temperature, catalyst loading and reaction time, with a genuine optimum for the optimizer to find. Simulated time is compressed, so a two-hour hold takes a couple of seconds.
Start it
Section titled “Start it”In the desktop app, choose Try the example on the welcome page (or Add a deck → Try the
example later). The app writes a short script and the example drivers into an example folder in
your home directory, starts it, and opens its page when it is ready.
From a source checkout, run it from a terminal instead and open http://localhost:8080:
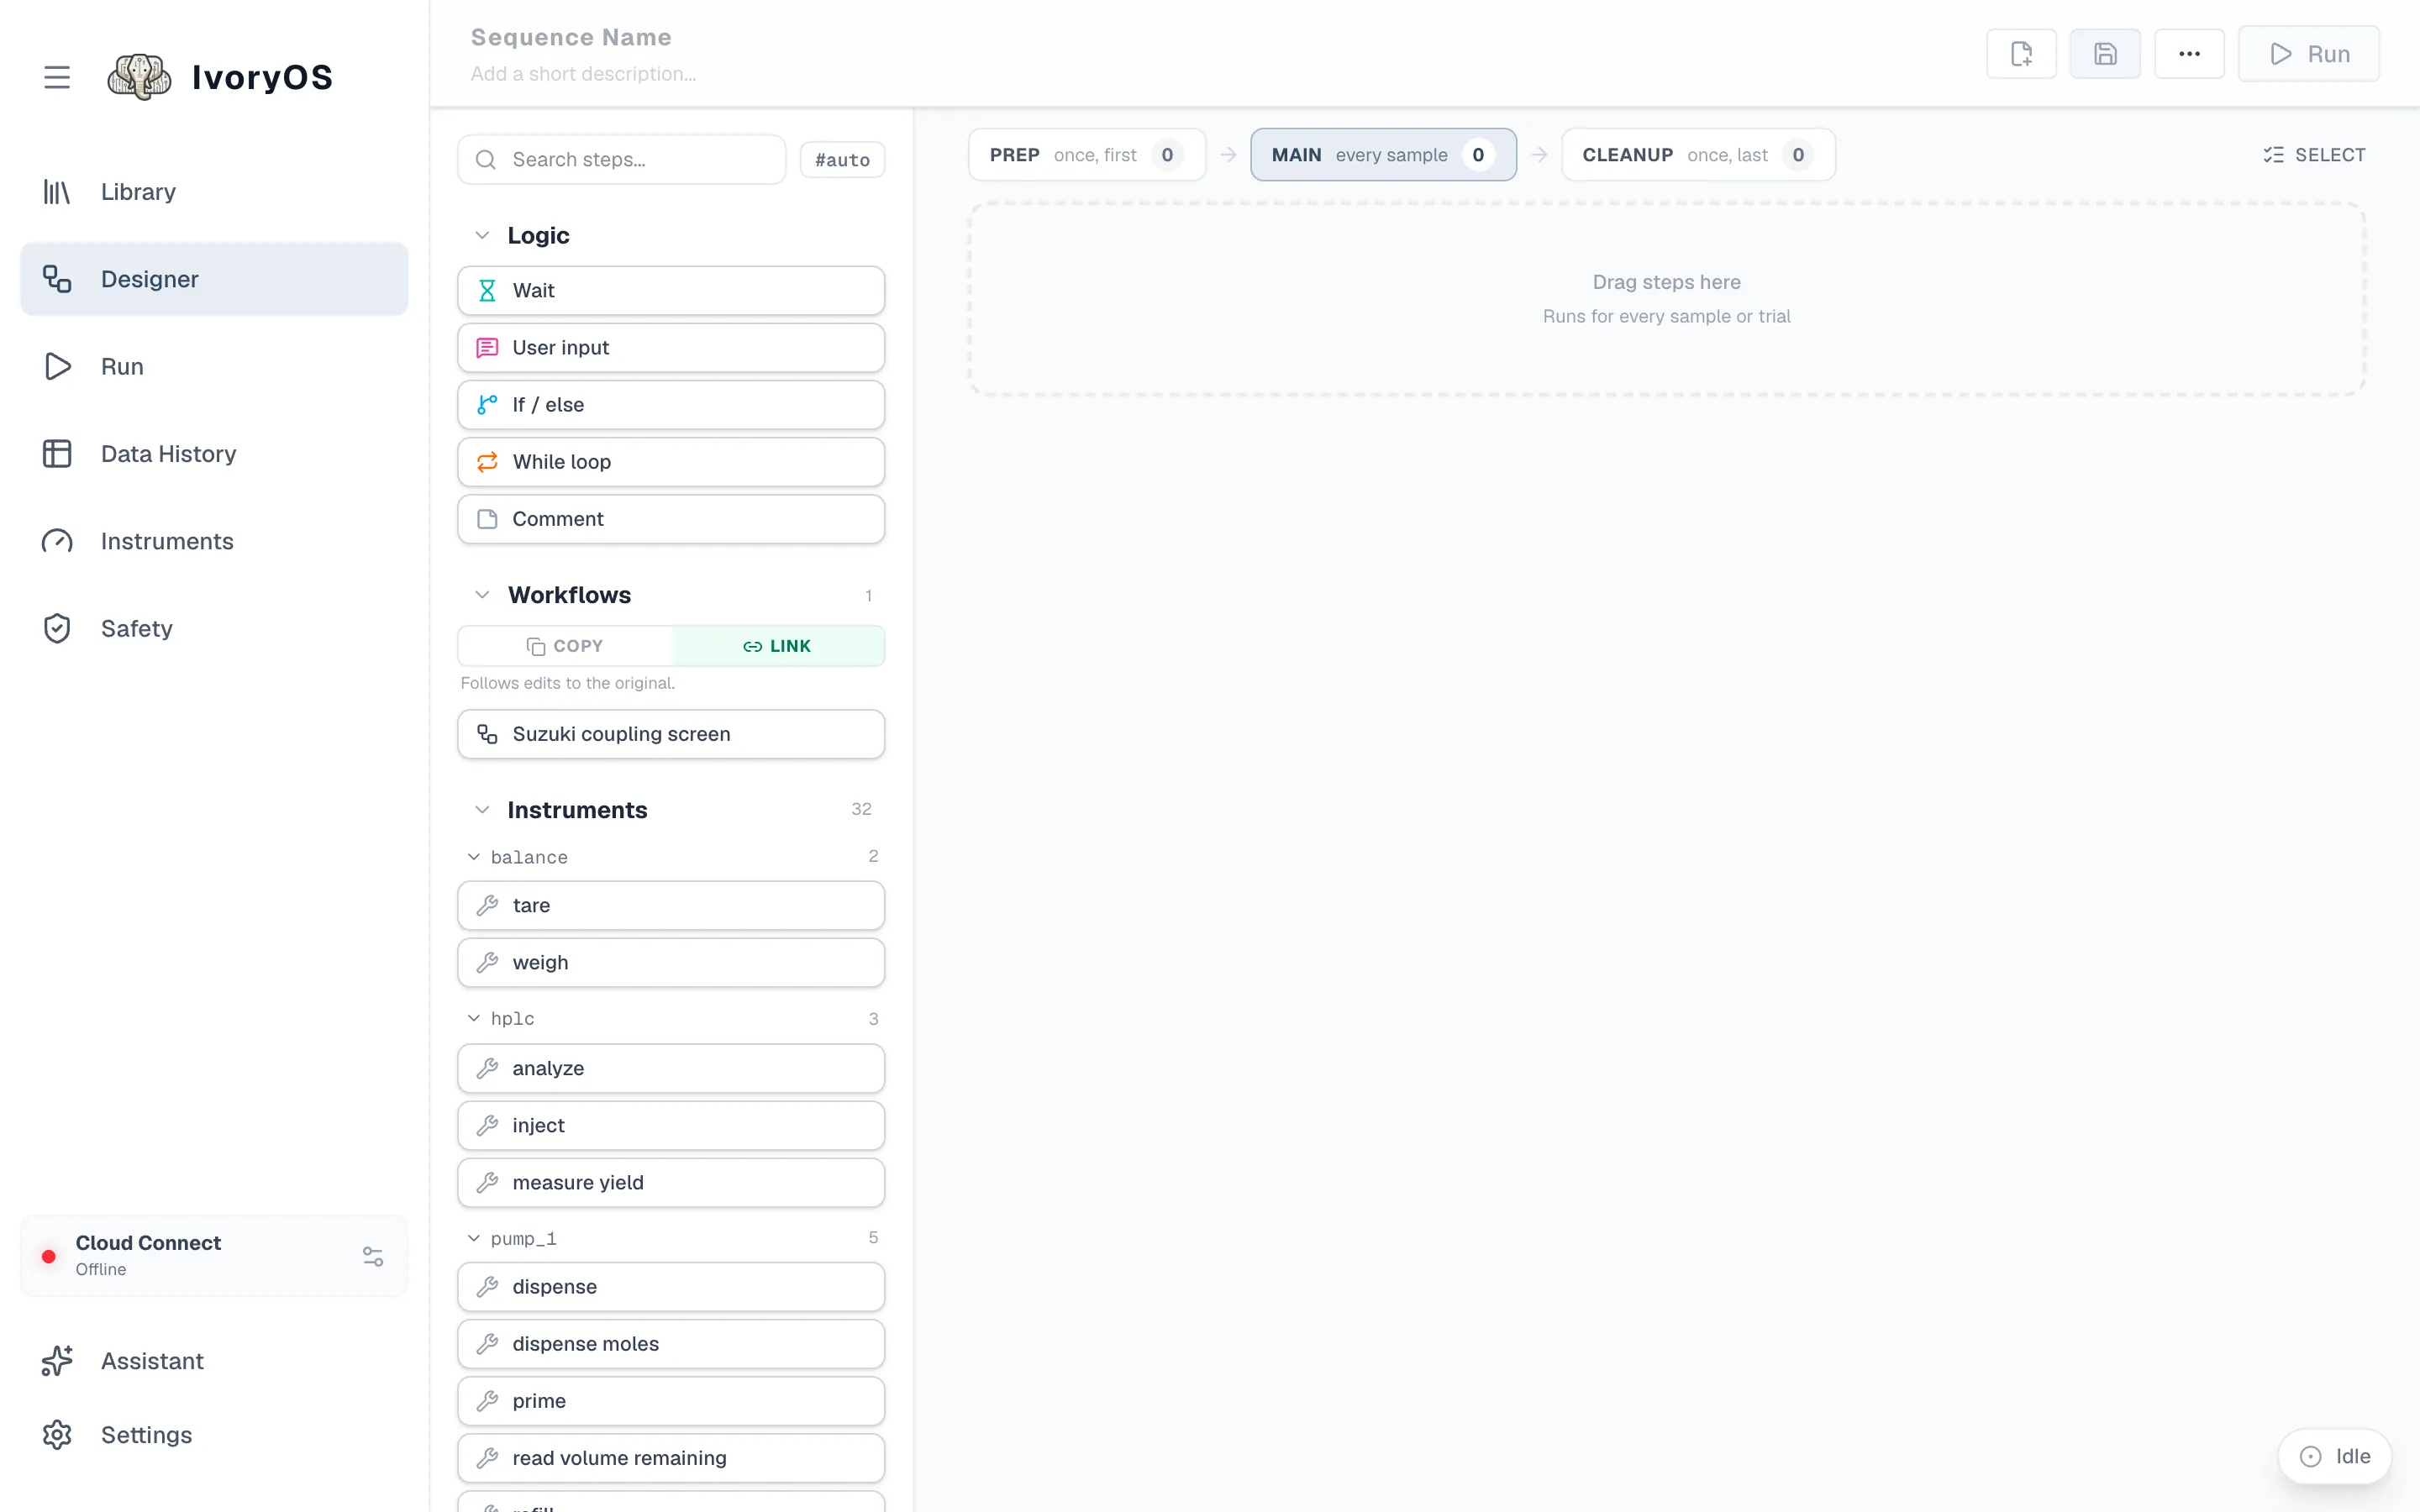
python example/demo.pyEither way you land on the Designer, with the deck’s instruments listed down the left as steps you can drag.
Load the ready-made workflow
Section titled “Load the ready-made workflow”-
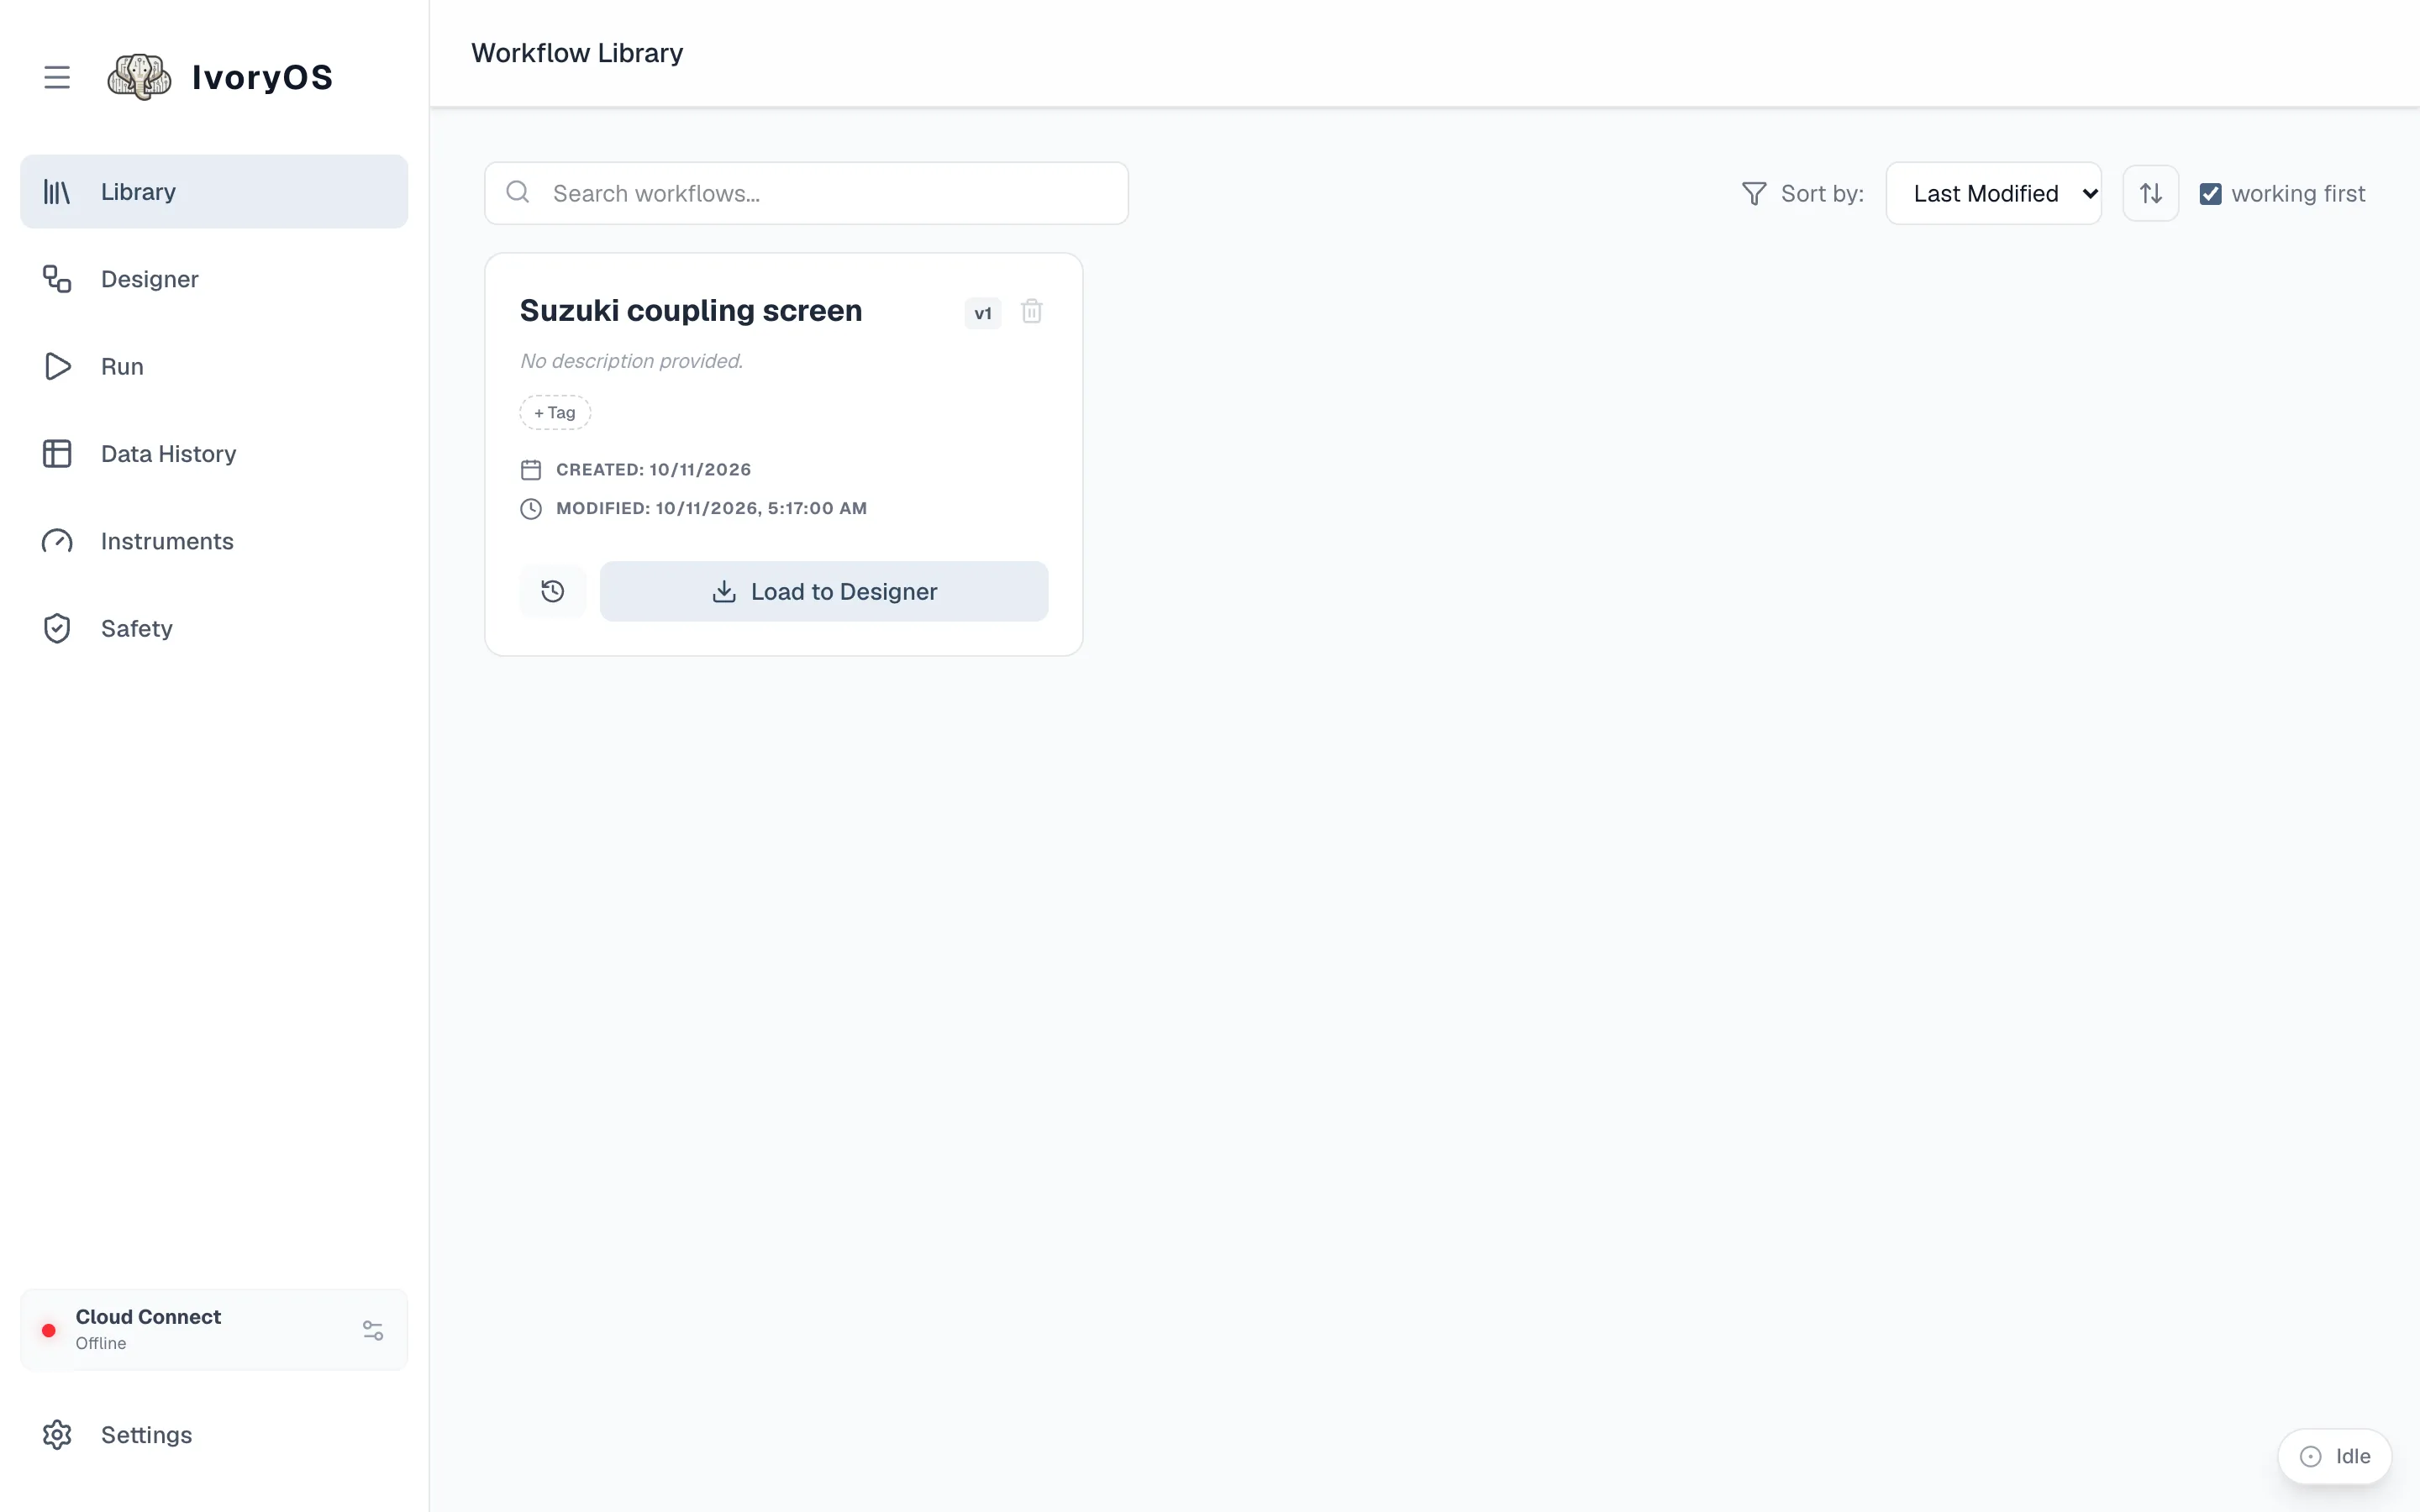
Open Library in the sidebar. The example ships with one saved workflow, Suzuki coupling screen.
-
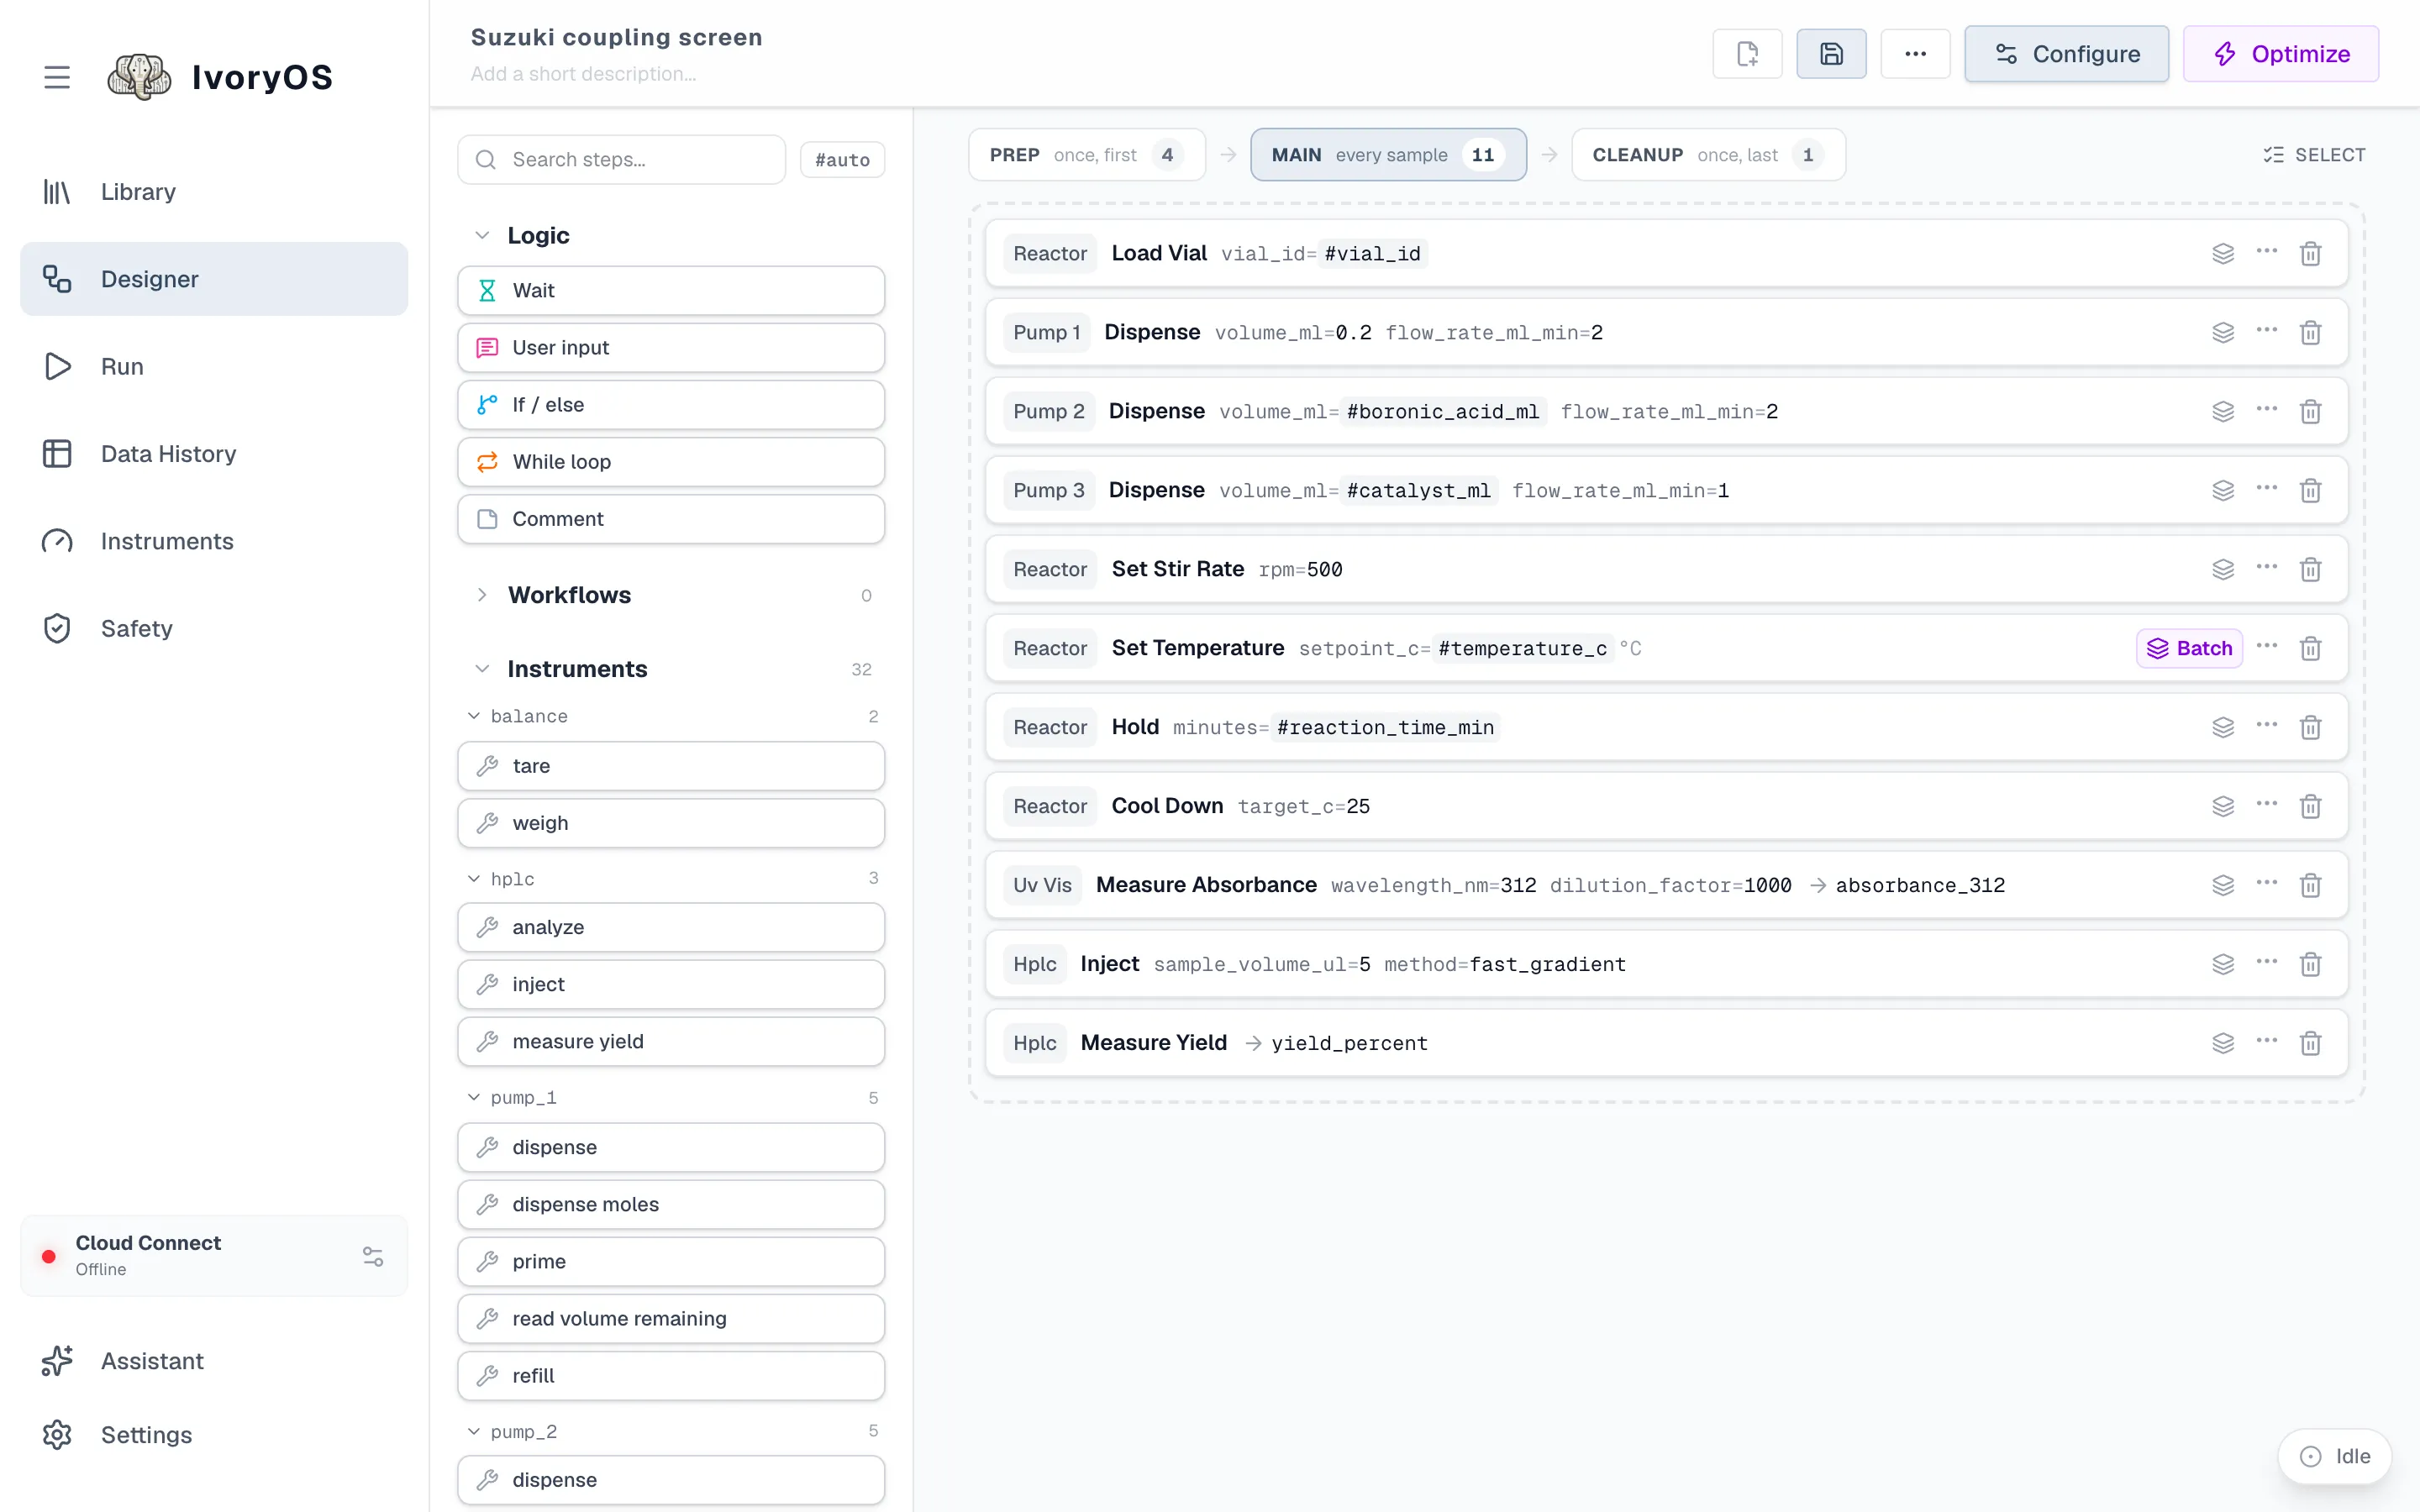
Click Load to Designer. The Designer opens with the workflow on its canvas: load a vial, dispense three reagents, stir, heat, hold, cool, then measure absorbance and yield.
-
Read the steps. Some values are typed in (
volume_ml=0.2); others are written as a#variable(setpoint_c=#temperature_c). A#variableis a value left open, to be filled in when the workflow is run. The last two steps save what they measure (→ absorbance_312,→ yield_percent).
Run it once
Section titled “Run it once”-
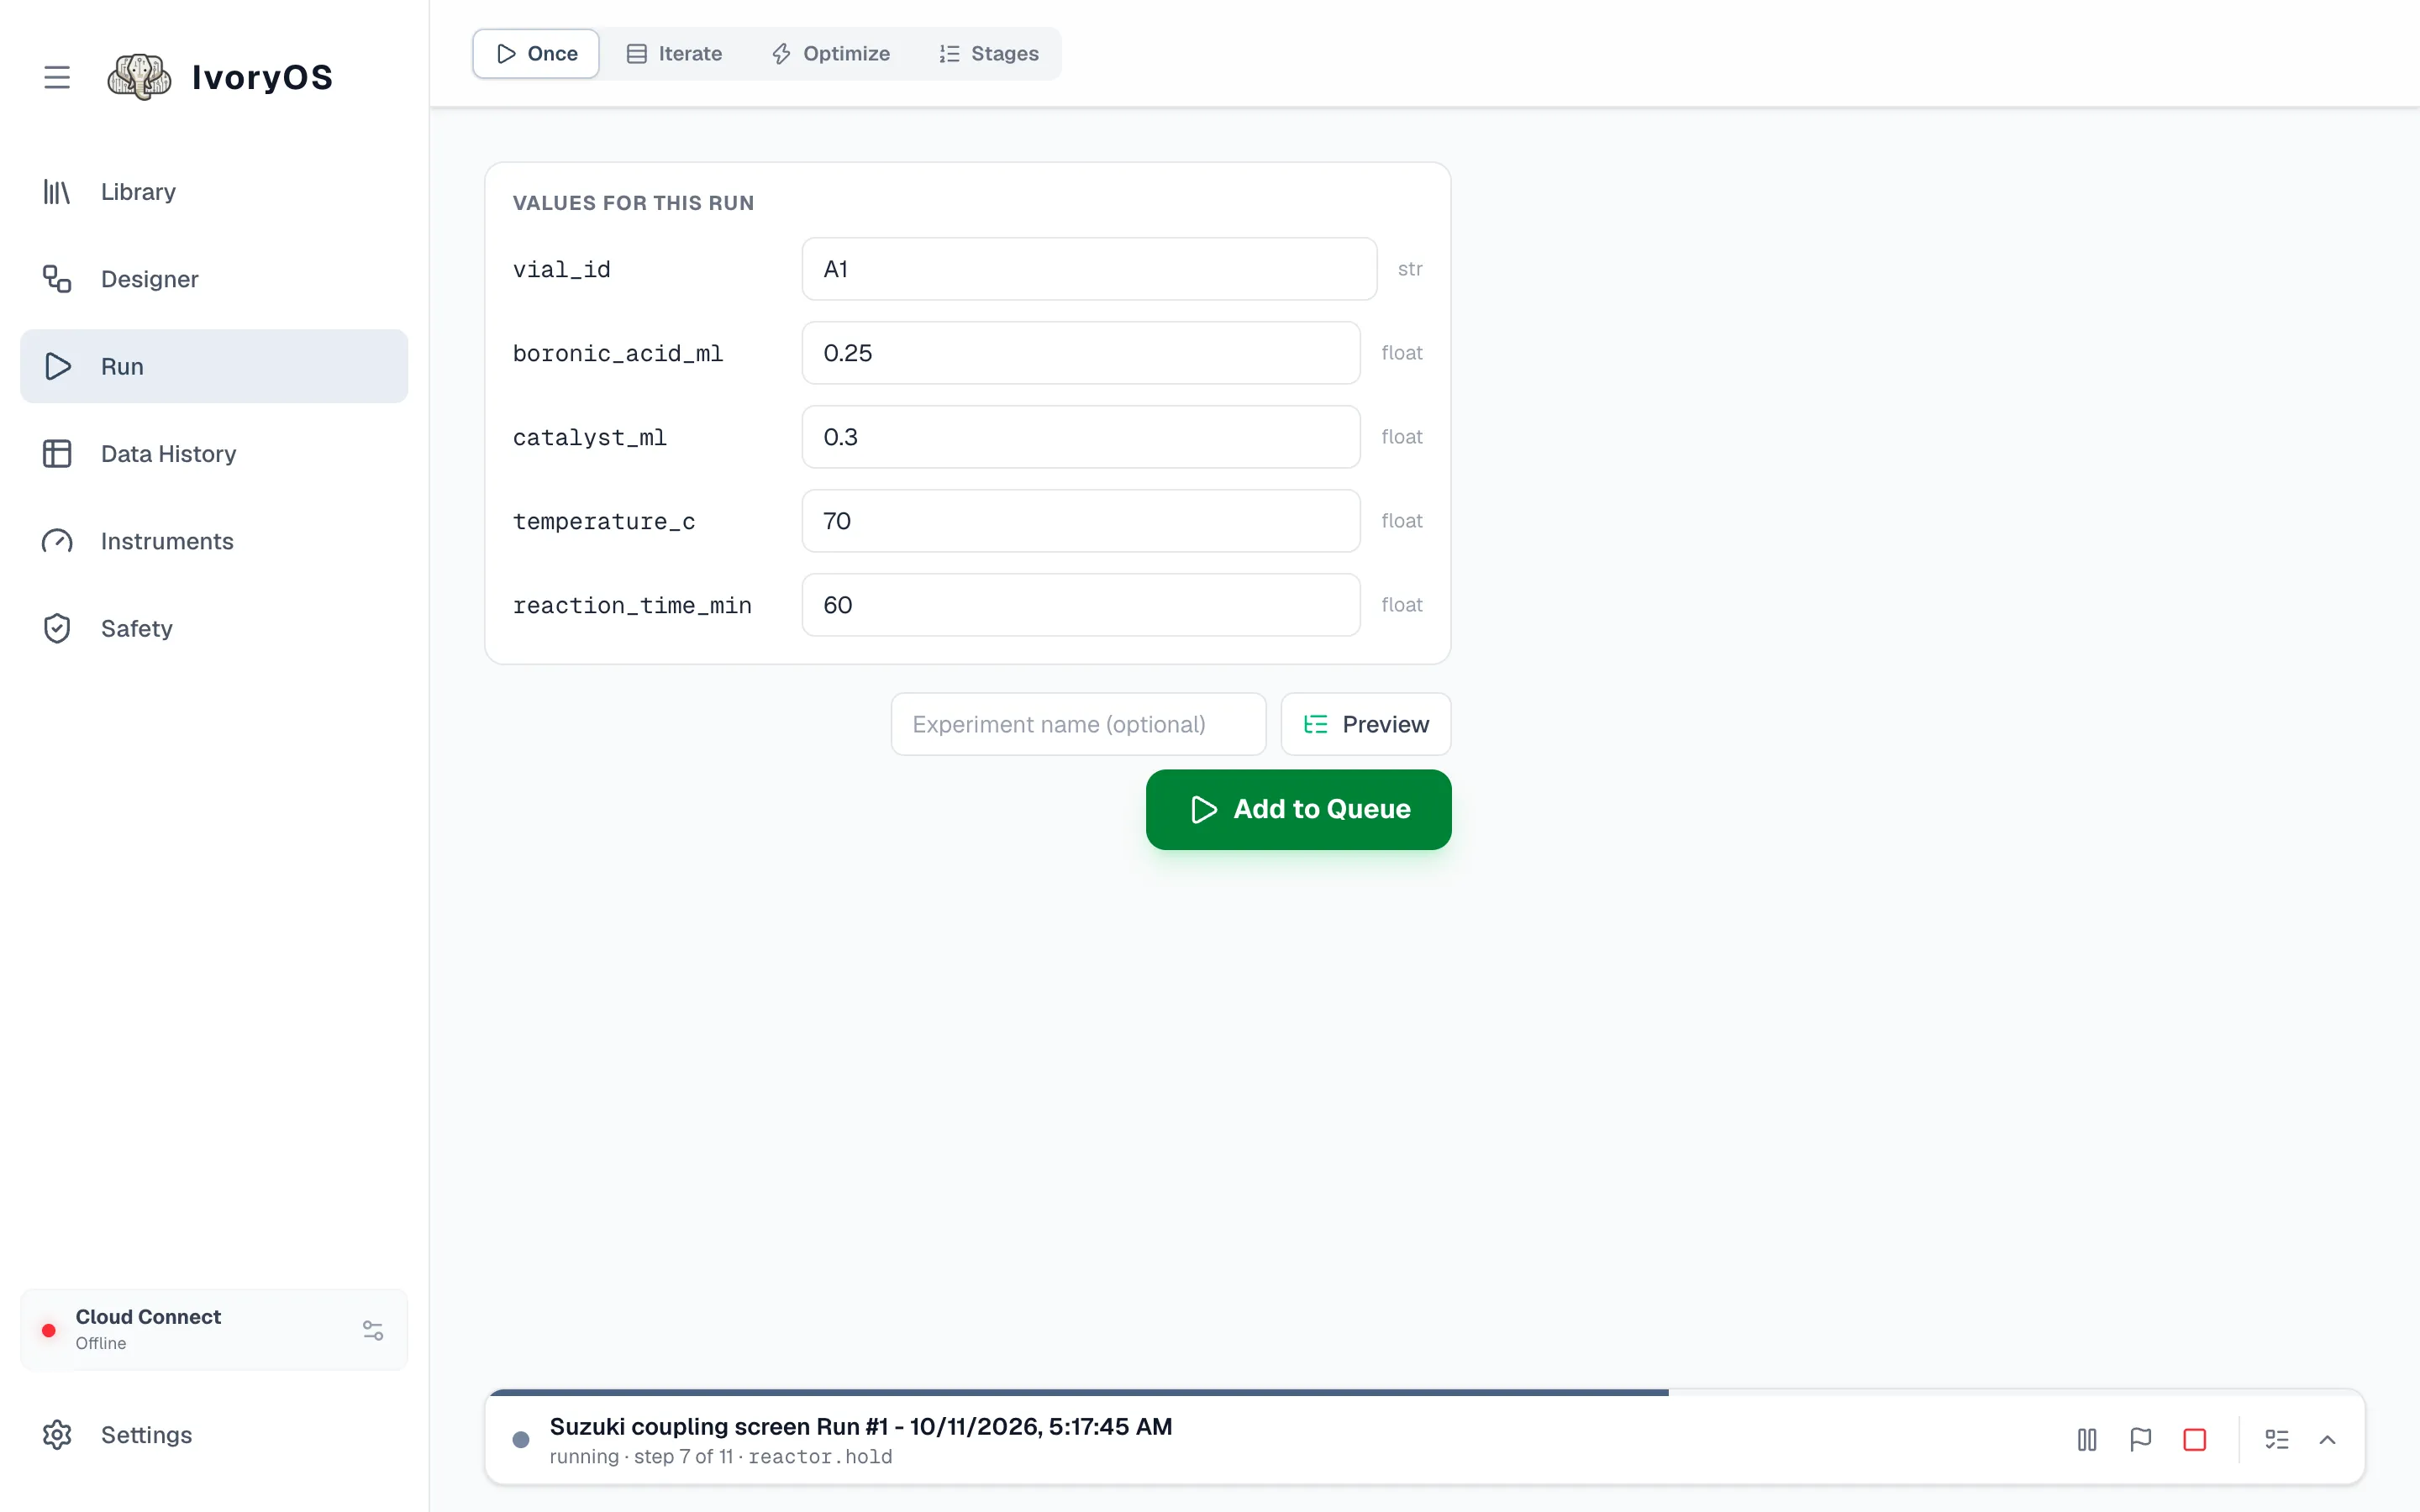
Click Configure at the top right (the button reads Run when a workflow has no open values). It opens the Run page on its Once tab, with one field per
#variable.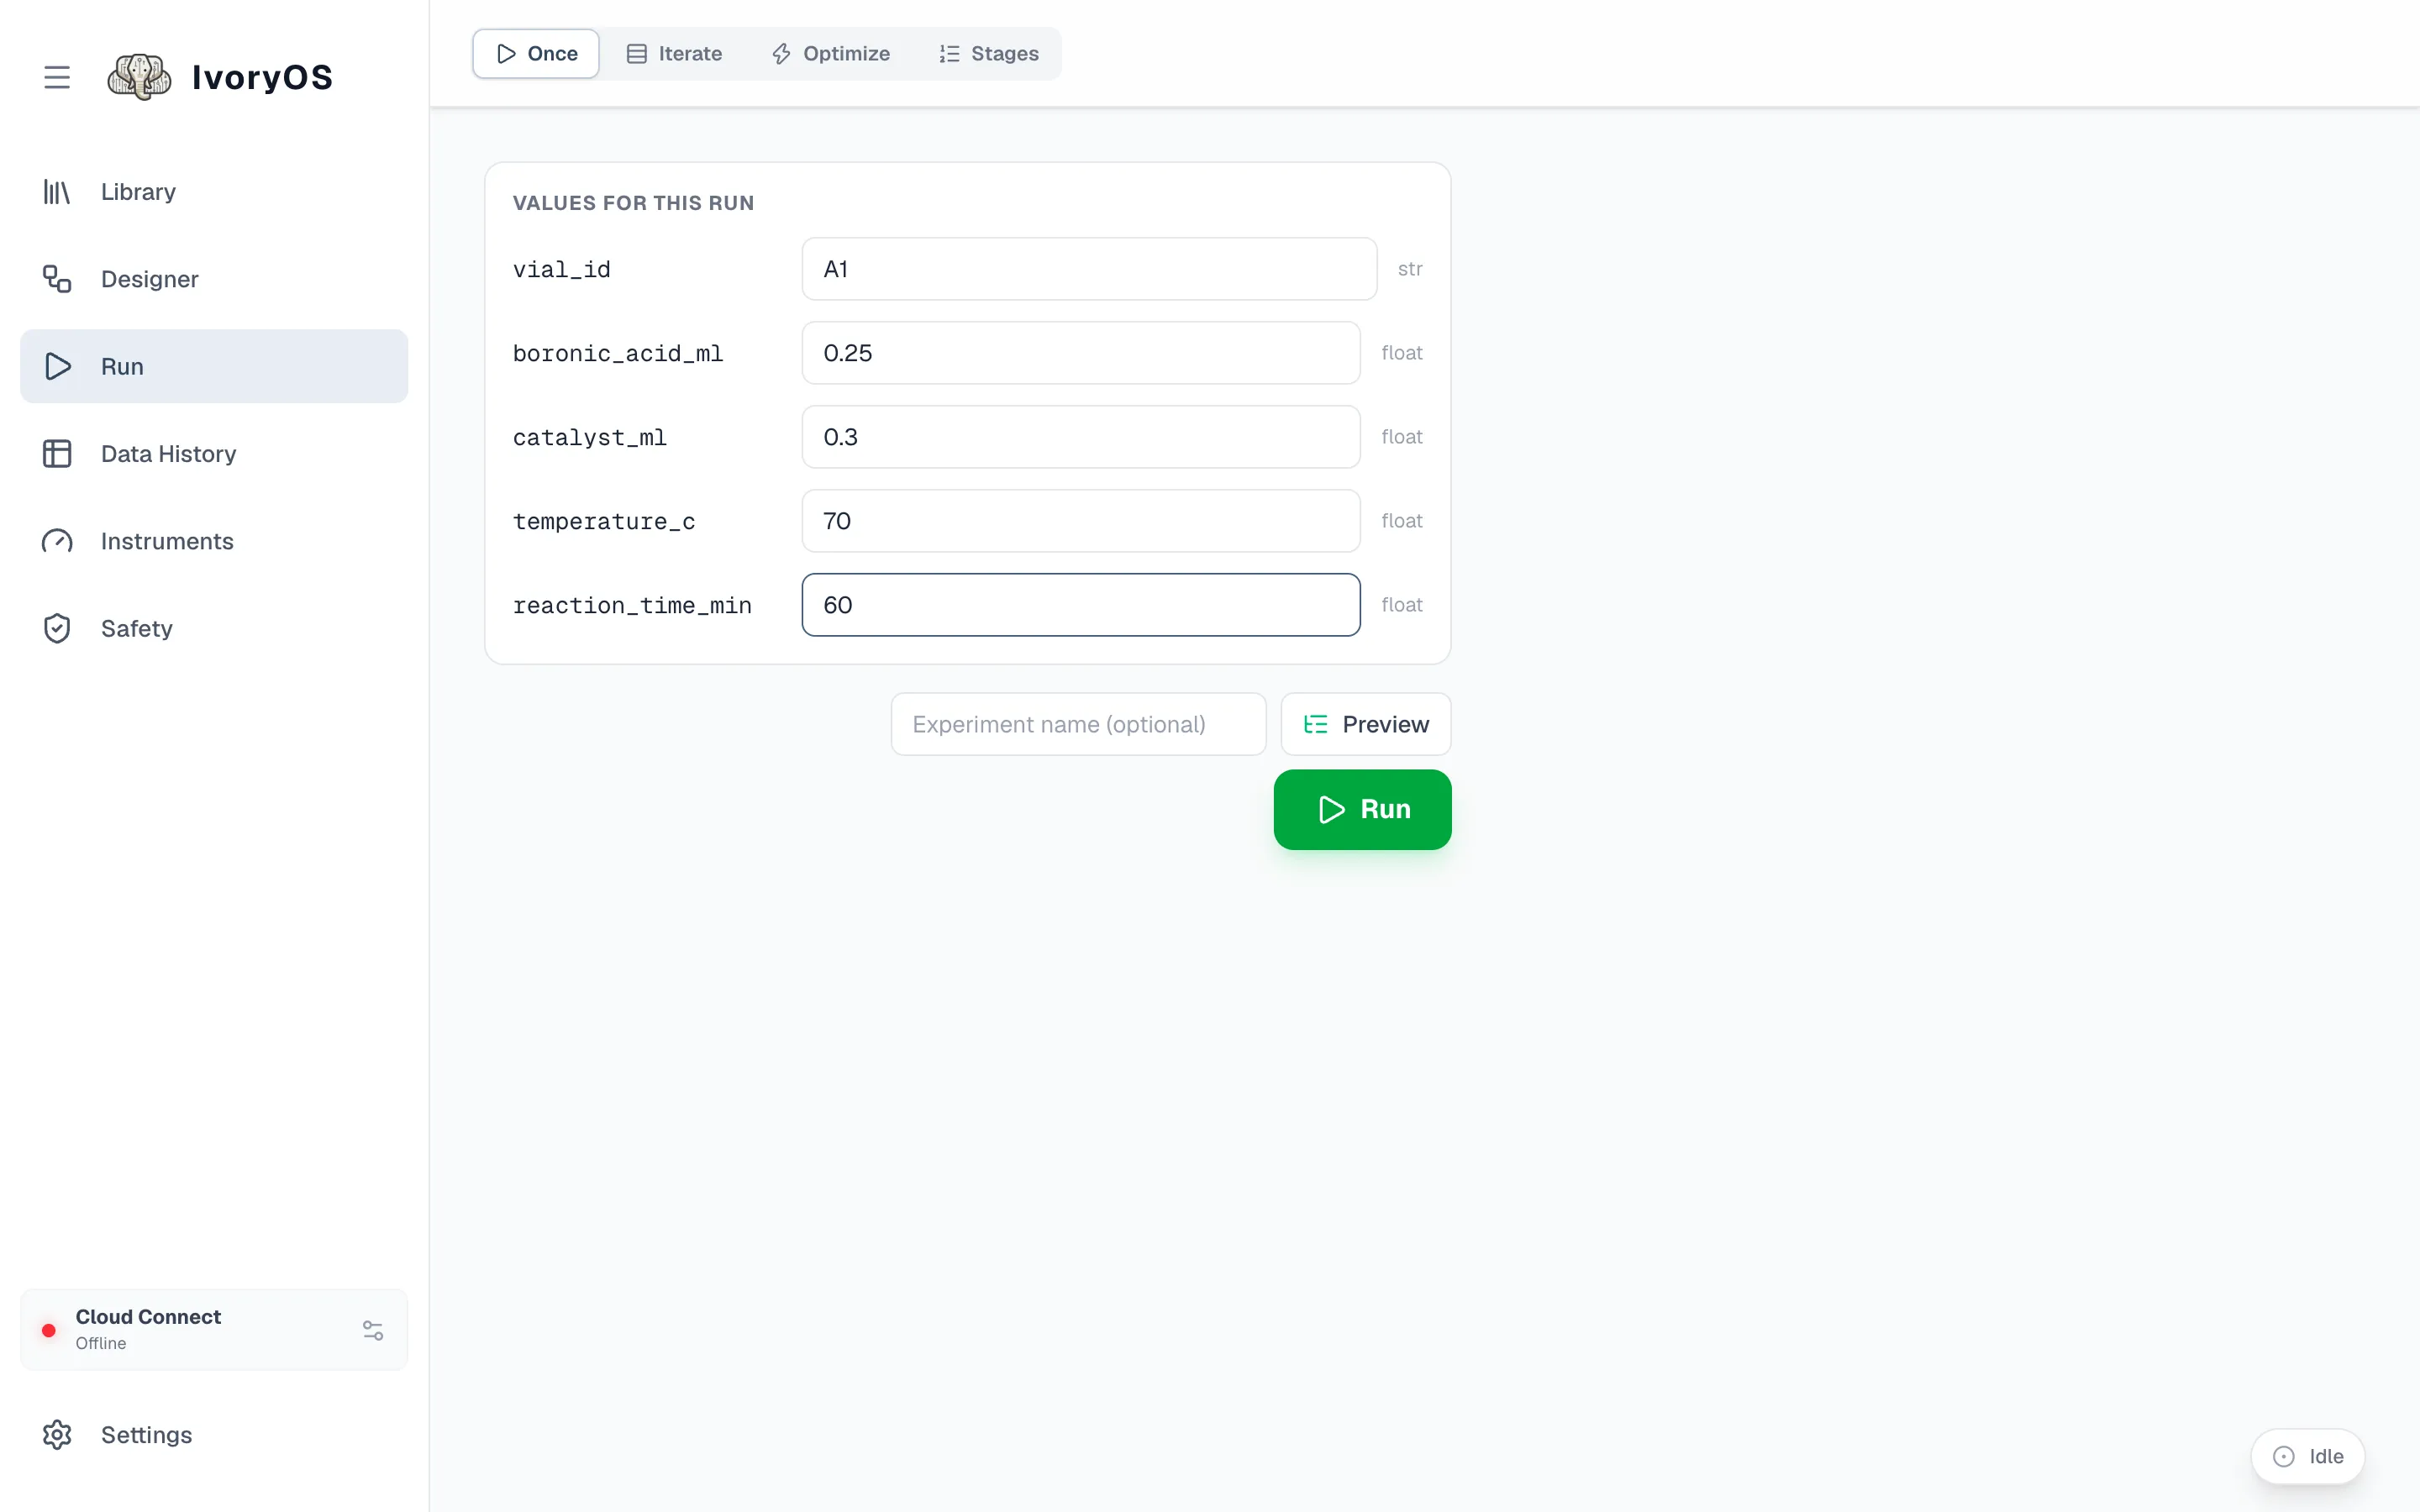
-
Fill in a sample:
vial_idA1,boronic_acid_ml0.25,catalyst_ml0.3,temperature_c70,reaction_time_min60. Give the run a name if you like; left blank, it is numbered. -
Click Preview to see exactly what will run, step by step, then Run.
-
Watch the run bar at the bottom of the page: it names the step the deck is on, and opens to show every step with its result as it comes in. The whole run takes about ten seconds here.
Read the result
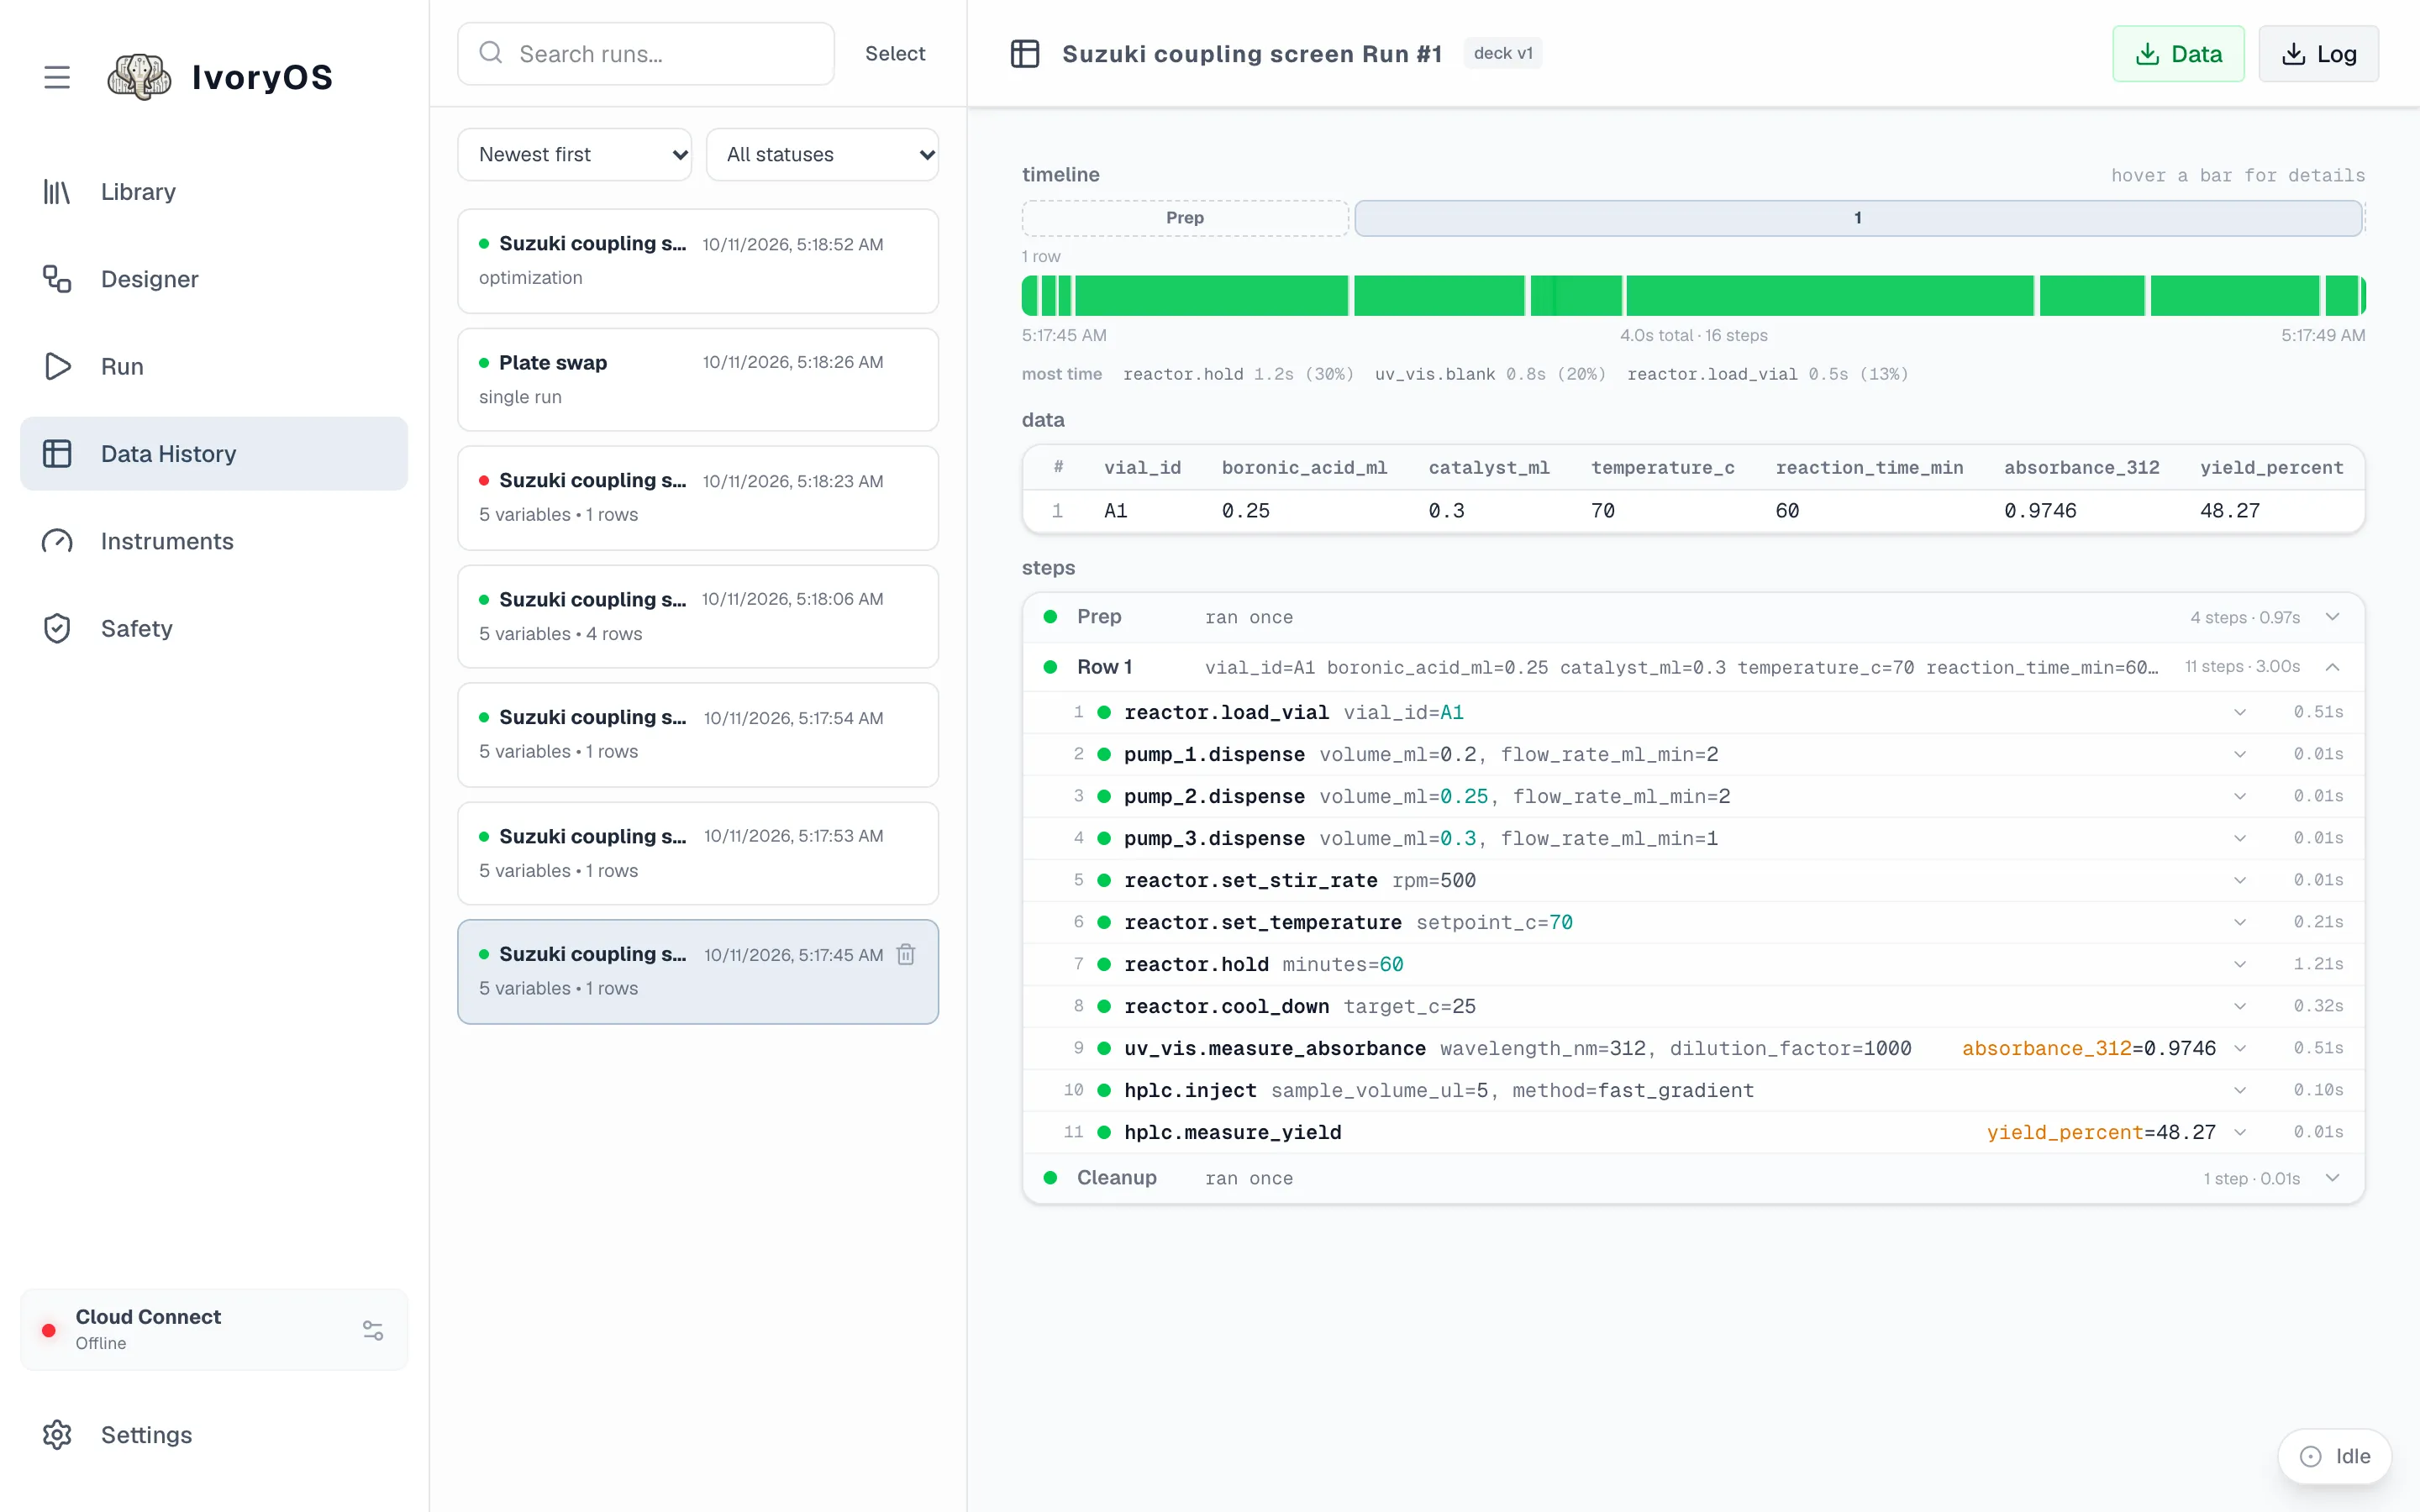
Section titled “Read the result”Open Data History. The run is at the top of the list; select it to see every step, its arguments and what it returned, and a timeline of how long each took. Export Data gives you a CSV with one column per value you typed in and one per value a step saved.
Where next
Section titled “Where next”- Iterate runs the same workflow over a spreadsheet of samples.
- Optimize lets a Bayesian optimizer choose the temperature and catalyst loading for you. On the example deck, first add an optimizer under the deck’s Settings in the desktop app.
- The Designer is where to change the workflow or build your own.